


Finmo’s statistics
The data reflected in the following charts and graphs was collected between January 17th 2020 and June 6th 2020, unless otherwise noted visually on the graph itself.
The data was collated from more than 15,000 Finmo mortgage applications.
Male/Female
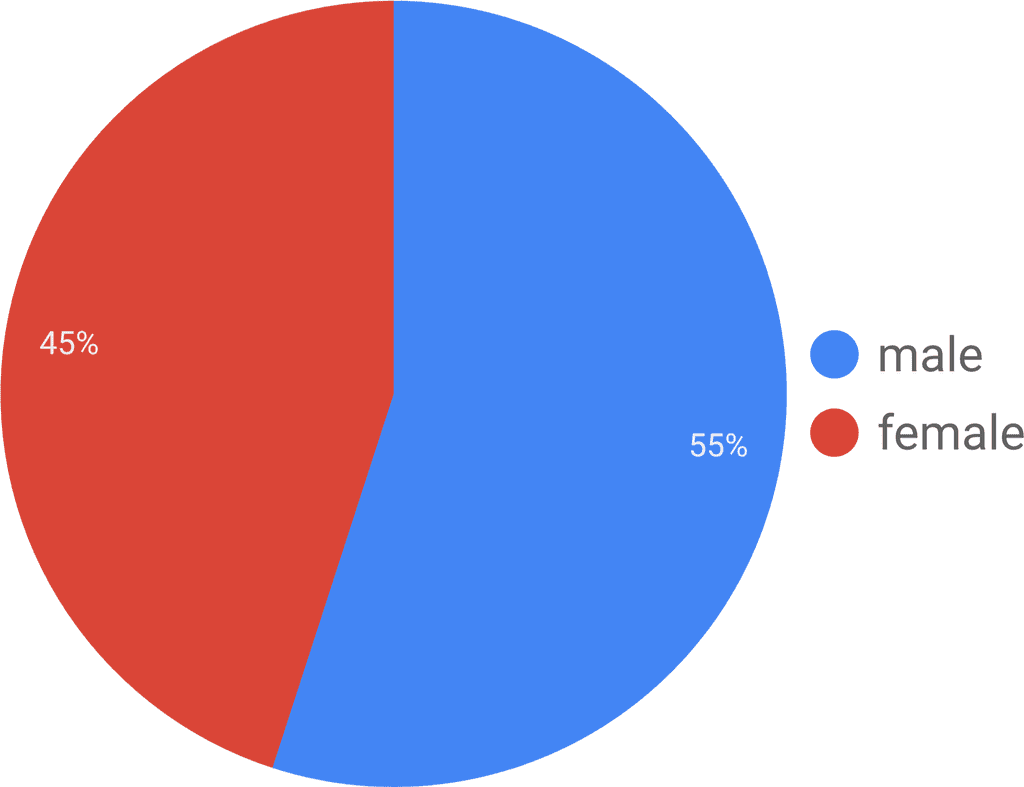
We are unsure as to why there are more male applicants than female applicants, though we have a hypothesis.
This 2016 article from Canadian Mortgage Trends states:
“Specifically, males were twice as likely as females to have received down payment money from mom and dad. The survey found that 39% of males aged 18-34 acknowledged receiving down payment money from their parents—compared to just 19% of females.”
From the we see that younger generations are utilizing DMPs (Digital Mortgage Platforms) like Finmo at a greater rate than older generations – particularly the 18-34 age range
- which could exaggerate this effect.
We do not suspect however that this phenomenon is “risk” related, with men being more likely to purchase in a “risky” economic environment. The 45-55% ratio has changed by less than 2% over time the last few months (no change before COVID-19 or during).
We believe the imbalance is caused by cultural reasons rather than by Finmo itself being preferred by a specific sex.
Further research is required for accurate conclusions to be drawn.
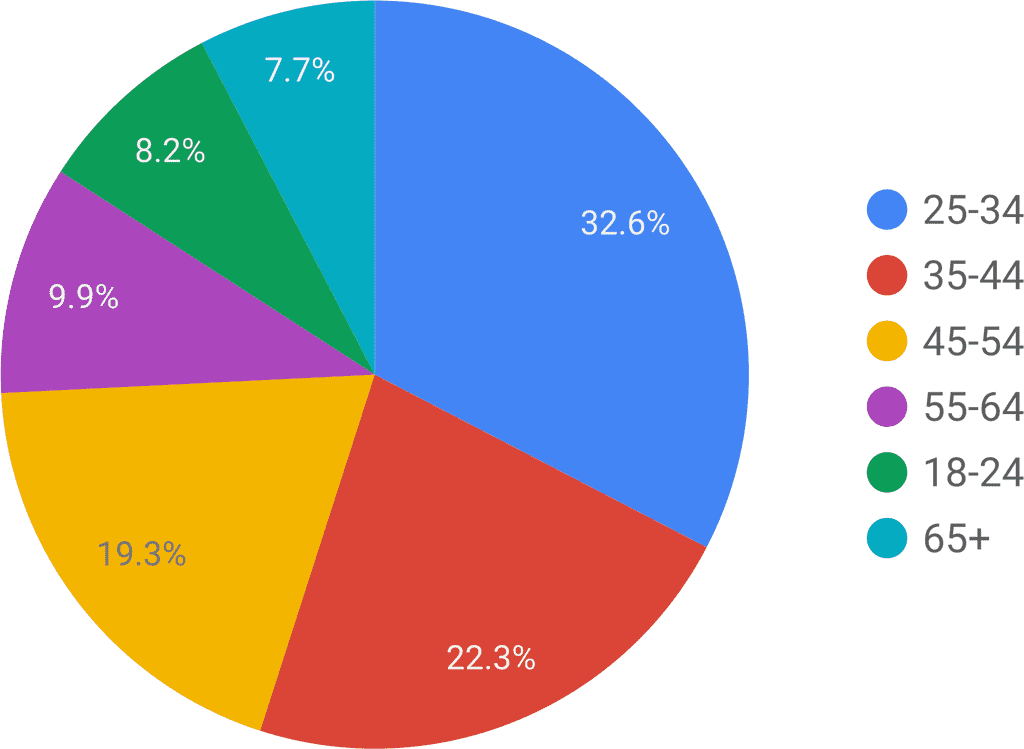
Age
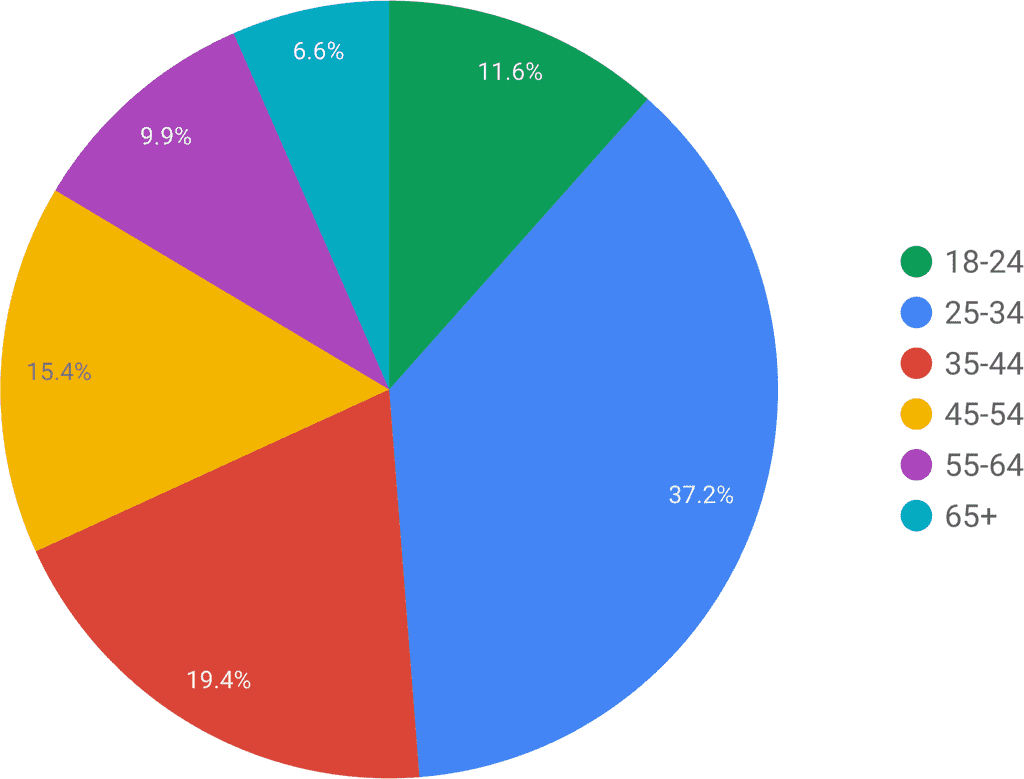
If we look at the age ranges of Finmo borrowers we find that there is a healthy love of the technology across all age groups, with no age groups unrepresented.
The reasons why younger borrowers (under 44) make up the majority of Finmo users could be:
- Younger people are doing more mortgage deals in general.
- Younger people are more open to getting a mortgage from a business that is not a chartered bank.
- Younger people are familiar with modern technology and are actively looking for the digital mortgage experience offered by DMPs (like Finmo).
- People refinancing may be older, and the mortgage professionals may be running through their refinances on older mortgage platforms which already contain the borrower’s data. For them to show up in our data, they would need to re-originate them within Finmo.
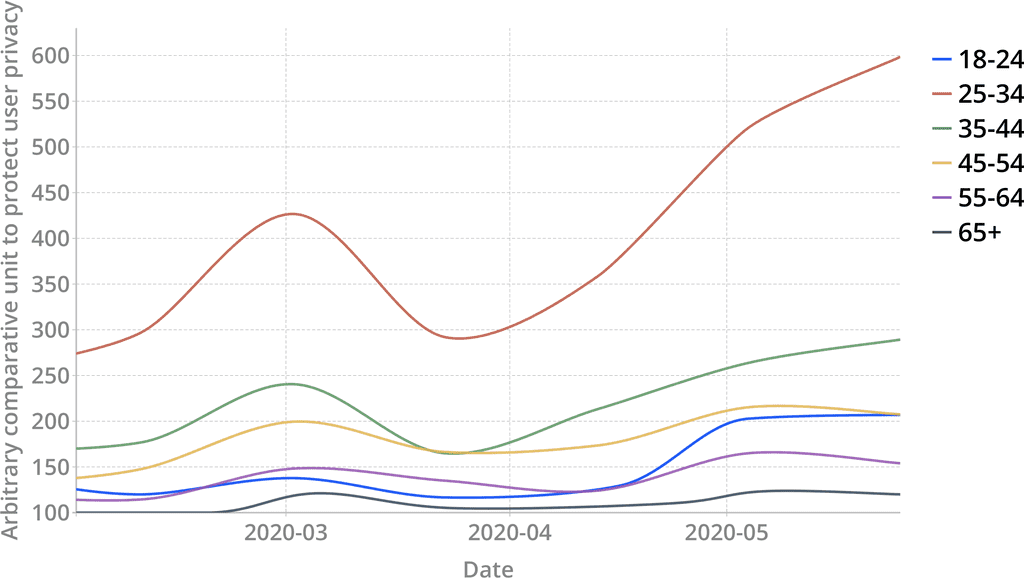
In this figure we can see that younger borrower’s usage of Finmo has skyrocketed lately. We suspect this is young people taking advantage of the falling house prices – a buyers market. CMHC predicts house prices will fall 9%-18% this year. The drop in prices appears to have already be creating a strong buyer’s market for younger buyers.
The upcoming CMHC insurance rule changes to borrower qualifying ratios has likely also been a boon to younger mortgage borrowers. The (largely misunderstood) legislation is likely causing younger borrowers to attempt to originate their mortgages before July 1st, 2020.
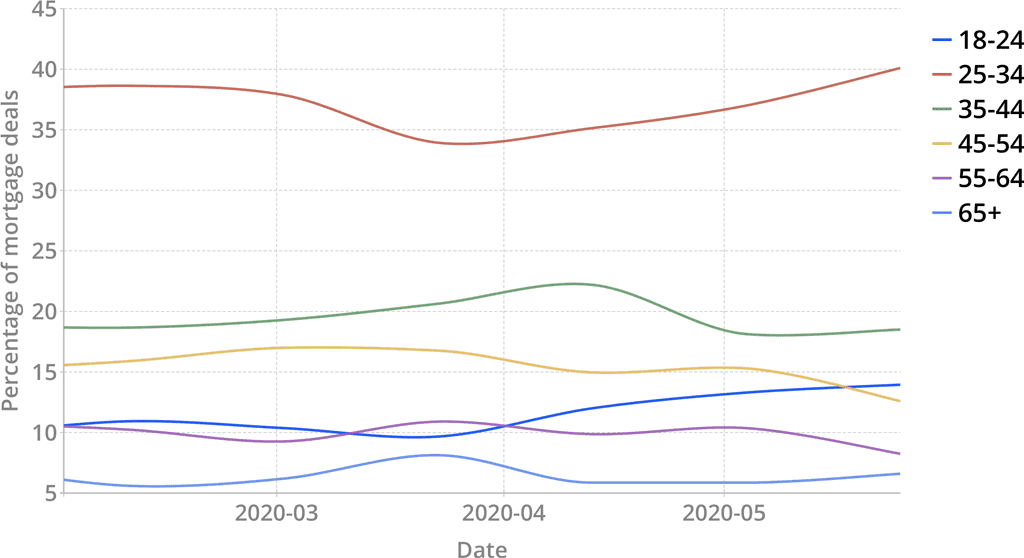
Again, this graph of percentage of deals per age demographic over time demonstrates a strong upward trend for younger mortgage borrowers – particularly for 18-24 year olds.
We can see other trends in here as well, such as people of age over 44 showing increased mortgage activity in mid-March (likely mainly refinances and renewals), due to speculation and uncertainty around the lasting effects of COVID-19.
Provinces

| Province | Percentage |
|---|---|
| Ontario | 46.87% |
| British Columbia | 27.02% |
| Alberta | 13.29% |
| Nova Scotia | 4.67% |
| Quebec | 4.16% |
| Saskatchewan | 3.36% |
| New Brunswick | 1.23% |
| Manitoba | 0.97% |
| Prince Edward Island | 0.69% |
| Newfoundland and Labrador | 0.34% |
| Northwest Territories | 0.08% |
| Yukon | 0.08% |
| Nunavut | 0.03% |
Finmo recently added a French version of the mortgage application, so we feel that Quebec numbers are likely to increase going forward.
Applications submitted from other countries
| Country | Percentage |
|---|---|
| United States | 1.73% |
| United Kingdom | 0.09% |
| Mexico | 0.05% |
We were surprised that there were far more mortgage applications submitted from the United States than from 7 Canadian provinces.
Web traffic channels
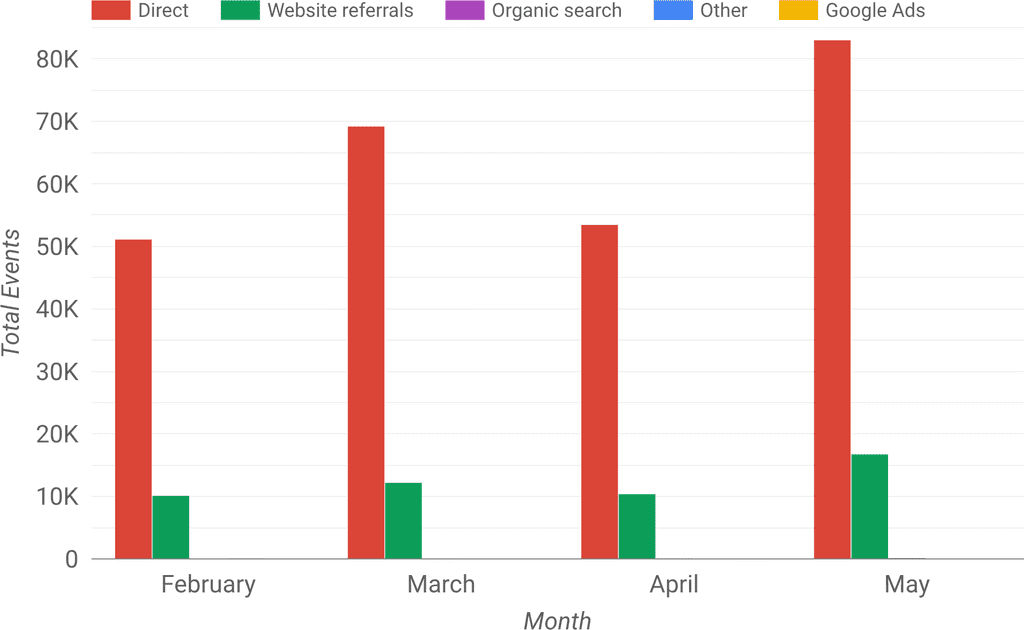
Events are an internal metrics we use to measure activity internally at Finmo.
An event is a borrower action we digitally track to optimize Finmo to be as smooth of a process as possible.
What does this graph’s legend mean?
- Direct
- This means the borrower was linked directly to the Finmo mortgage application.
- Website referrals
- This means the borrower was linked to the application from a website (likely a mortgage professional telling a borrower to go to their website, which then links to the Finmo mortgage application.
- Organic search
- This means a borrower found a Finmo mortgage application directly from a search engine (Google, Yahoo, Bing, etc). This is a fairly unlikely scenario as they would likely find a website first that then links to the mortgage application.
- Google Ads
- This is people who entered the Finmo application directly from a Google Ad. It is very surprising that almost no one has. It is possible mortgage professionals are linking ads to their website instead of Finmo‘s lead generation calculator or application, but from other internal research we’ve performed we find the level of advertising amongst brokers on Google is just very low in general. It appears that advertising on Facebook is very limited as well, but we do not have nearly as much visibility on that.
In our opinion, this graph represents that the mortgage brokering business in Canada is still a very personal and in-person referral based. What’s most interesting from this chart is not what’s in it – it’s what is missing.
Paid advertising results make up extremely little of the total submitted mortgage applications.
We believe there is absolutely massive opportunity in paid advertising going forward, as it seems to be a wildly under-utilized asset compared to other industries.
Mortgage borrowers in Canada have an affinity for the big five banks and may be hesitant to apply for mortgages online with no personal referral. We foresee that phobia changing in the future as the United States and the United Kingdom see much higher levels of online mortgage origination. For example, large online advertising based brokerages such as Trussle and Habito have been operating for years in the United Kingdom.
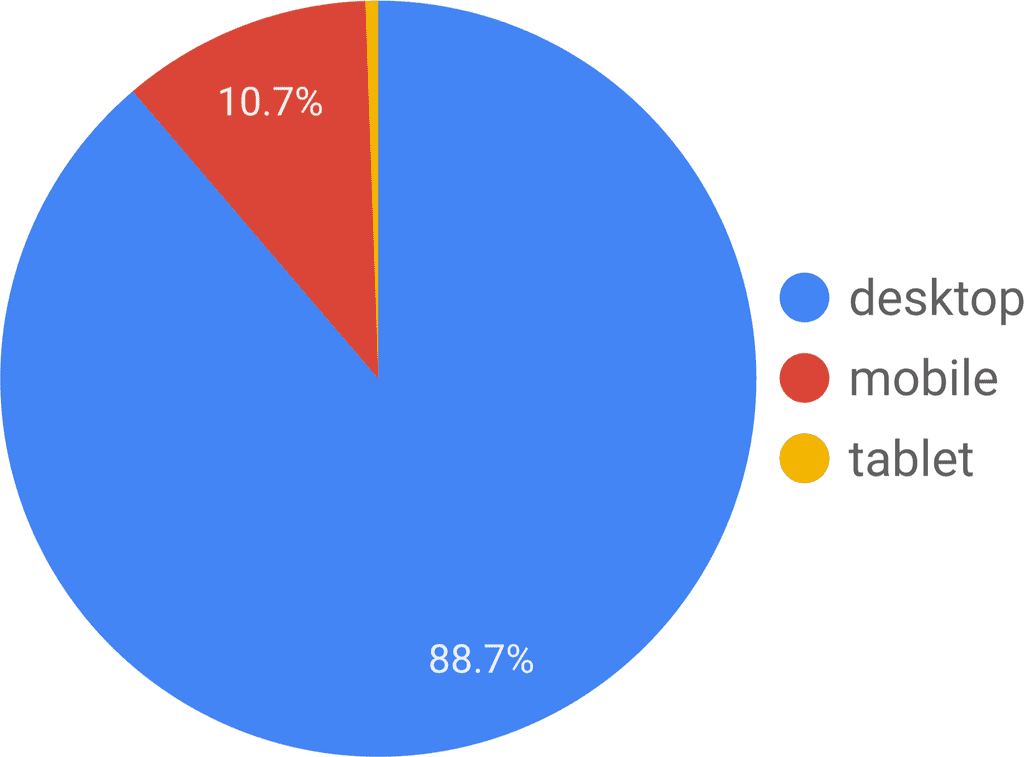
Device categories
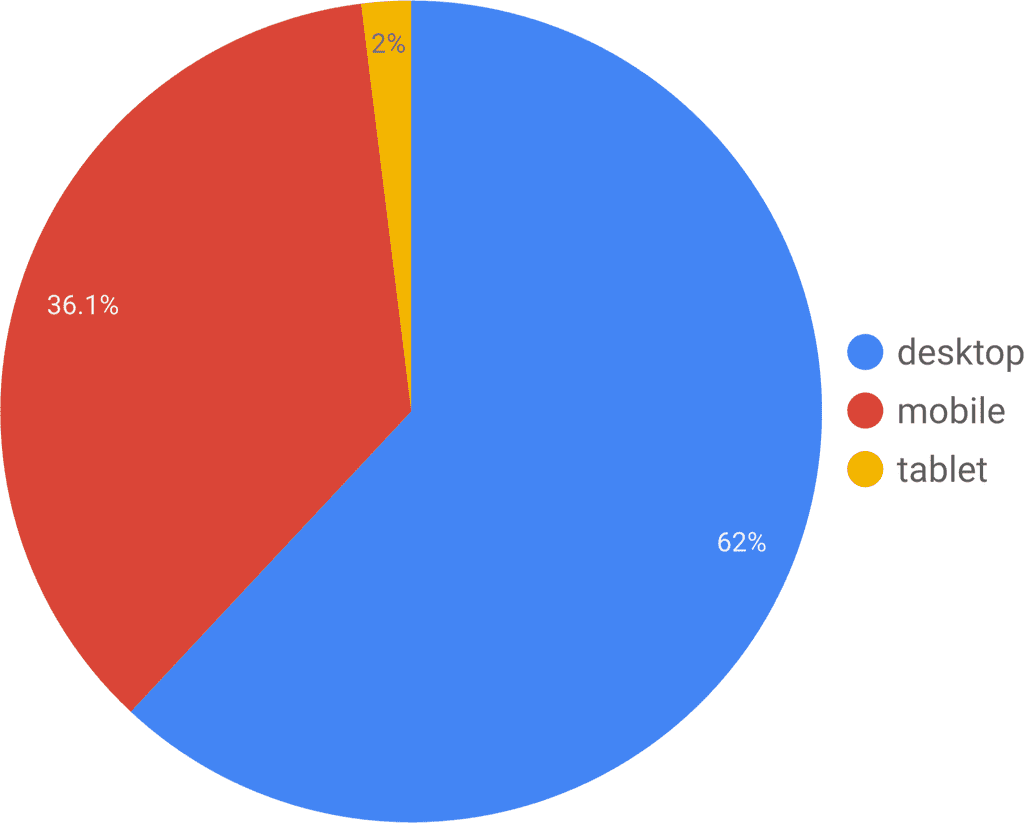
Although Finmo has the ability to operate effectively on all categories and devices, borrowers still prefer to do the data entry required for their mortgage application on a desktop computer.
This is not very surprising, as a keyboard is a much quicker tool for filling out a mortgage application than a phone for most people.
We were fairly surprised however that 36.1% of borrowers fill out the entire application entirely on their phone – more than one third of borrowers!
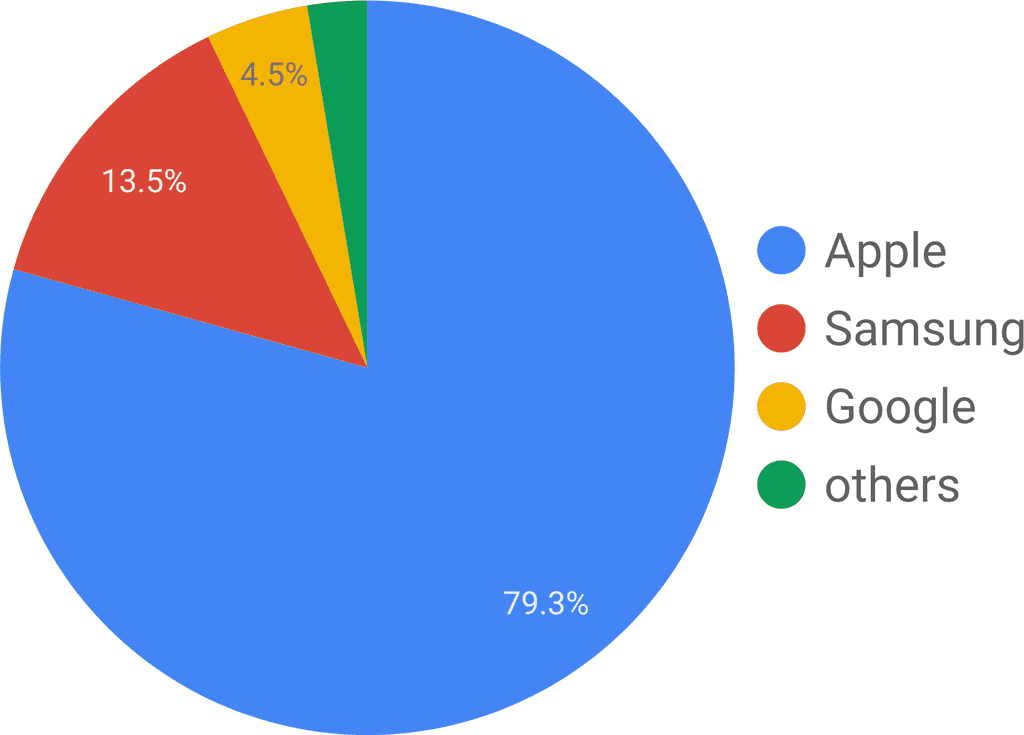
Mobile device brands
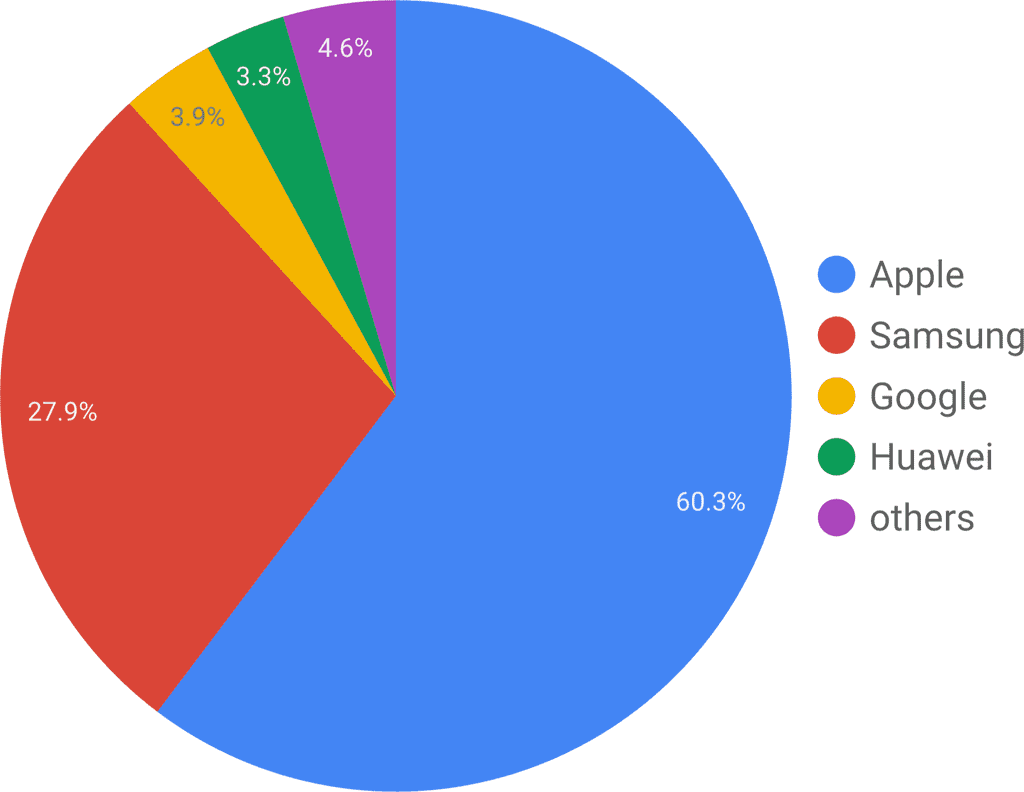
On this pie chart we can see that Apple’s mobile products are the most commonly used by borrowers to fill out mortgage applications on Finmo.
The number one mobile device series used to submit Finmo mortgage applications is the Apple iPhone.
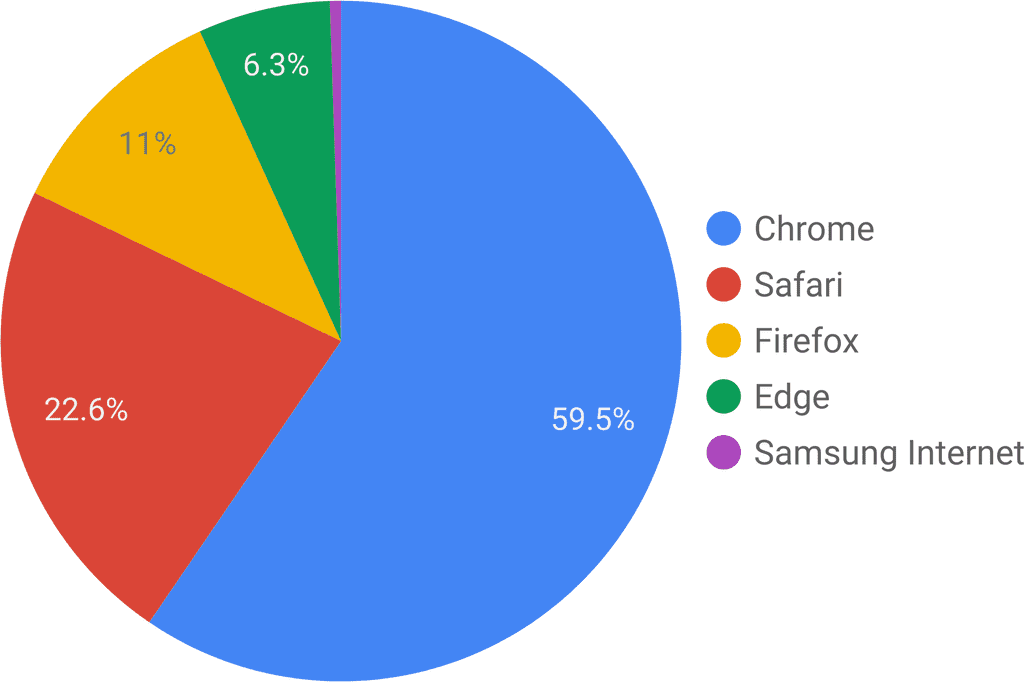
Web browsers
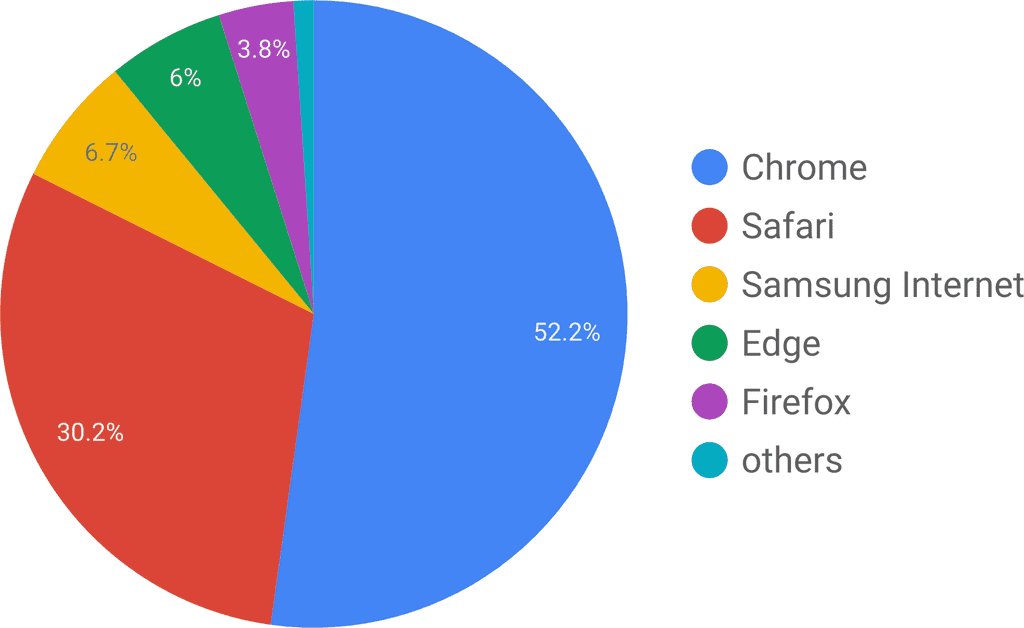
| Browser | Device category | % of borrowers |
|---|---|---|
| Chrome | Desktop | 43.39% |
| Safari | Mobile | 20.02% |
| Safari | Desktop | 9.30% |
| Chrome | Mobile | 8.59% |
| Samsung Internet | Mobile | 6.48% |
| Edge | Desktop | 6.08% |
| Firefox | Desktop | 3.76% |
| Others | Various (including tablets) | 3.09% |
Google Chrome has the lion’s share of desktop Finmo mortgage applications with a 43.39% share. The vast majority of Finmo applications, approximately 62%, are submitted from desktop computers.
Languages
| Language | Percentage |
|---|---|
| English | 98.73% |
| French | 0.71% |
| Chinese | 0.13% |
| Korean | 0.07% |
| Russian | 0.06% |
| Others | 0.30% |
The majority of users that submitted applications to Finmo had their web browsers set to the English language. French made a disproportionately low showing, but this could be because Finmo only recently added full French translation to the borrower application. We expect to see French language representation increase over the years.
Google demographic information
This information is provided by the Google analytics platform. It uses Google’s vast wealth of user browser activity to find commonalities and trends in user behaviours.
This information is useful to better understand more about the modern mortgage borrower and what their interests and behaviours are. With this powerful information, we can identify interesting trends to create advertising campaigns that really resonate with the target audience.
Top affinity categories
Affinity categories are “interests” that are shared between people that submitted a mortgage application. For example, 16.79% of 18-24 year olds that submitted a Finmo mortgage application share an affinity for “frequently eating breakfast out”. Who knew breakfast foods and mortgage origination had such a high correlation?
A striking trend is the very strong correlation between motorcycles, bicycles and mortgages in the 25-34 year range.
A bizarre trend is 35-44 year old rap & hip hop fans correlating to 16.43% of application submissions for that age group – the strongest correlation in the demographic!
Age range: 18-24 years
| Affinity category | % of borrower apps |
|---|---|
| Frequently Eats Breakfast Out | 16.79% |
| Fashionistas | 15.71% |
| Pet Lovers | 15.67% |
| Beauty Mavens | 15.54% |
| Gamers | 15.28% |
| Coffee Shop Regulars | 15.27% |
| Home Decor Enthusiasts | 15.22% |
| Thrill Seekers | 15.03% |
| Department Store Shoppers | 14.98% |
| Nightlife Enthusiasts | 14.90% |
| Auto Enthusiasts | 14.72% |
| Fast Food Cravers | 14.66% |
| Green Living Enthusiasts | 14.61% |
| Business Travelers | 14.44% |
| TV Lovers | 14.43% |
| Outdoor Enthusiasts | 14.36% |
| Light TV Viewers | 14.34% |
| Hardcore Gamers | 14.34% |
| Travel Buffs | 14.32% |
| Shutterbugs (photographers) | 14.30% |
| Home & Garden/Do-It-Yourselfers | 14.26% |
| Frequently Visits Salons | 14.24% |
| Sports Fans | 14.21% |
| Movie Lovers | 14.32% |
| Frequently Eats Dinner Out | 14.14% |
| Comics & Animation Fans | 14.11% |
| Rap & Hip Hop Fans | 14.02% |
Age range: 25-34 years
| Affinity category | % of borrower apps |
|---|---|
| Motorcycle Enthusiasts | 18.74% |
| Cycling Enthusiasts | 17.75% |
| Snowbound Travelers | 15.99% |
| Beachbound Travelers | 15.01% |
| Baseball Fans | 14.94% |
| Indie & Alternative Rock Fans | 14.77% |
| Luxury Travelers | 14.69% |
| Family Vacationers | 14.68% |
| Performance & Luxury Vehicle Enthusiasts | 14.44% |
| Auto Enthusiasts | 14.33% |
| Thrill Seekers | 14.32% |
| Outdoor Enthusiasts | 14.23% |
| Frequently Eats Breakfast Out | 14.18% |
| Green Living Enthusiasts | 14.17% |
| Family Movie Fans | 14.17% |
| Truck & SUV Enthusiasts | 14.15% |
Age range: 35-44 years
| Affinity category | % of borrower apps |
|---|---|
| Rap & Hip Hop Fans | 16.43% |
| Rock Music Fans | 15.64% |
| Fast Food Cravers | 15.62% |
| Beachbound Travelers | 15.62% |
| Frequently Attends Live Events | 15.52% |
| Convenience Store Shoppers | 15.35% |
| Luxury Travelers | 14.69% |
| Soccer Fans | 15.09% |
| Pet Lovers | 14.95% |
| Frequently Eats Breakfast Out | 14.87% |
| Hockey Fans | 14.85% |
| Green Living Enthusiasts | 14.79% |
| Music Lovers | 14.67% |
| Game, Reality & Talk Show Fans | 14.61% |
| Family Movie Fans | 14.17% |
| Performance & Luxury Vehicle Enthusiasts | 14.44% |
| Department Store Shoppers | 14.41% |
| Cooking Enthusiasts | 14.40% |
| Pop Music Fans | 14.39% |
| TV Lovers | 14.38% |
| American Football Fans | 14.35% |
| Basketball Fans | 14.27% |
| Auto Enthusiasts | 14.06% |
| Hardcore Gamers | 14.02% |
Age range: 45-54 years
| Affinity category | % of borrower apps |
|---|---|
| Truck & SUV Enthusiasts | 17.78% |
| Luxury Travelers | 17.24% |
| Family Vacationers | 16.63% |
| Rock Music Fans | 15.60% |
| Beachbound Travelers | 15.45% |
| Performance & Luxury Vehicle Enthusiasts | 15.14% |
| Avid Investors | 14.97% |
| Game, Reality & Talk Show Fans | 14.66% |
| Pop Music Fans | 14.64% |
| Frequently Eats Lunch Out | 14.53% |
| Auto Enthusiasts | 14.47% |
Age range: 55-64 years
| Affinity category | % of borrower apps |
|---|---|
| Shopaholics | 15.13% |
| Frequently Attends Live Events | 14.89% |
| Aspiring Chefs | 14.07% |
| Foodies | 14.02% |
Age range: 65+ years
| Affinity category | % of borrower apps |
|---|---|
| Movie Lovers | 15.00% |
| Value Shoppers | 14.92% |
| Technophiles | 14.81% |
| Luxury Shoppers | 14.75% |
| Book Lovers | 14.65% |
| Avid Political News Readers | 14.45% |
| Business Professionals | 14.18% |
| Entertainment News Enthusiasts | 14.18% |
| Home & Garden/Do-It-Yourselfers | 14.15% |
Top in-market segments
In-market segments refer to what borrowers are actively researching, or what the borrower’s are “in the market” for.
A concerning trend is the number of times employment or career consulting appears across the majority of age demographics. This could indicate a problematic trend of bankruptcies from the economic affects of COVID-19. It is likely that the borrowers researching employment opportunities are people who are submitting applications to refinance, but further research on our end is required to verify that hypothesis.
Some great advertising opportunities are exposed through this information as well, such as how 18-24 year olds that are looking into tax preparation services (or software) are likely to be getting serious about soon purchasing a house. Why this is valuable is it is a “leading indicator”, which could help a mortgage professional connect with potential borrowers before the competition.
Age range: 18-24 years
| In-market segment | % of borrower apps |
|---|---|
| Preowned Houses (For Sale) | 17.36% |
| Residential Properties (For Sale) | 16.97% |
| Residential Properties | 15.95% |
| Tax Preparation Services & Software | 15.83% |
| Home Decor | 15.23% |
| Residential Properties (For Rent) | 14.88% |
| Employment | 14.46% |
| Career Consulting Services | 14.16% |
| Advertising & Marketing Services | 14.09% |
Age range: 25-34 years
| In-market segment | % of borrower apps |
|---|---|
| Motorcycles (Used) | 18.89% |
| Resumes & Portfolios | 17.93% |
| Trips to Canada | 17.64% |
| Motorcycles | 17.59% |
| Trips to Toronto | 17.43% |
| Residential Properties (For Rent) | 14.88% |
| Off-Road Vehicles (Used) | 17.16% |
| Off-Road Vehicles | 16.97% |
| Beauty Products & Services | 16.71% |
| Vacation Packages | 16.64% |
| IT & Technical Jobs | 16.44% |
| Rugs & Carpets | 16.17% |
| Audio | 16.06% |
| Beauty Products & Services | 16.71% |
| Trips to the US | 15.92% |
| Air Travel | 15.89% |
| Outdoor Recreational Equipment | 15.57% |
| Auto Parts & Accessories | 15.55% |
| Lights & Fixtures | 15.53% |
| Executive & Management Jobs | 15.48% |
| Televisions | 15.43% |
| Plumbing Fixtures | 15.35% |
| Luxury Vehicles (Used) | 15.33% |
| Home Furnishings/Kitchen & Dining Room | 15.27% |
| Auto Repair & Maintenance | 15.14% |
| Motor Vehicles by Brand/Honda | 15.11% |
| Hotels & Accommodations | 15.09% |
| Home Furnishings/Living Room | 15.05% |
| Internet Service Providers | 15.01% |
| Vacation Rentals | 14.98% |
| Pickup Trucks (Used) | 14.97% |
| Accounting Software | 14.94% |
| Pickup Trucks | 14.78% |
| Car Rental | 14.64% |
| Luxury Vehicles | 14.63% |
| Garden & Outdoor Furniture | 14.61% |
| Wheels & Tires | 14.55% |
| Career Consulting Services | 14.42% |
| Apartments (For Rent) | 14.25% |
| Tools | 14.23% |
| Computer Accessories & Components | 14.16% |
| Staffing & Recruitment Services | 14.13% |
| Home Decor/Bedding | 14.11% |
| Home Appliances | 14.05% |
Age range: 35-44 years
| In-market segment | % of borrower apps |
|---|---|
| Auto Exterior Parts & Accessories | 20.39% |
| Sedans (Used) | 19.77% |
| Activewear | 19.11% |
| Vacation Packages | 18.93% |
| Sedans | 17.44% |
| Auto Parts & Accessories | 16.63% |
| Concert & Music Festival Tickets | 16.19% |
| Shoes | 15.54% |
| Luxury Vehicles | 15.54% |
| Staffing & Recruitment Services | 15.47% |
| Primary & Secondary Schools (K-12) | 14.74% |
| Post-Secondary Education | 14.65% |
| Air Travel | 14.59% |
| Trips to Canada | 14.40% |
| Pickup Trucks | 14.36% |
| Home Furnishings | 14.24% |
| Tools | 14.18% |
Age range: 45-54 years
| In-market segment | % of borrower apps |
|---|---|
| Vacation Rentals | 18.94% |
| Concert & Music Festival Tickets | 17.35% |
| Vacation Packages | 17.33% |
| Living Room | 16.88% |
| Business & Productivity Software | 16.44% |
| Apartments (For Rent) | 16.24% |
| Auto Parts & Accessories | 16.11% |
| Shoes | 15.54% |
| Air Travel | 16.09% |
| Women’s Apparel | 16.02% |
| Mobile Phones | 15.96% |
| Motor Vehicles (New) | 15.91% |
| Trips to Canada | 15.73% |
| Residential Properties (For Rent) | 15.27% |
| Staffing & Recruitment Services | 15.16% |
| Preowned Apartments (For Sale) | 15.01% |
| Tools | 14.96% |
| Pickup Trucks | 14.86% |
| Hotels & Accommodations | 14.51% |
| Landscape Design | 14.40% |
| Residential Properties | 14.39% |
| Motor Vehicles (Used) | 14.36% |
| Home & Garden Services | 14.36% |
| Home Improvement | 14.30% |
| Post-Secondary Education | 14.29% |
| SUVs (Used) | 14.13% |
| Residential Properties (For Sale) | 14.09% |
Age range: 55-64 years
| In-market segment | % of borrower apps |
|---|---|
| Apparel & Accessories | 15.99% |
| Preowned Houses (For Sale) | 15.80% |
| Residential Properties (For Sale) | 15.60% |
| Air Travel | 15.02% |
| Business & Productivity Software | 14.68% |
| Home Improvement | 14.30% |
| Trips to Canada | 14.59% |
| Advertising & Marketing Services | 14.22% |
| Hotels & Accommodations | 14.19% |
Age range: 65+ years
| In-market segment | % of borrower apps |
|---|---|
| Staffing & Recruitment Services | 18.06% |
| Preowned Houses (For Sale) | 15.80% |
| Residential Properties | 17.51% |
| Employment | 14.43% |
Top life event segments
Life event segments represent correlations to specific live events. These segments are generally more logically obvious than affinity or in-market segments.
Yes, someone who is recently married is very likely to submit a mortgage application – but surprisingly, someone who is 18-24 that just graduated is even more likely to submit a mortgage application!
Age range: 18-24 years
| Life event segment | % of borrower apps |
|---|---|
| Recently Graduated | 18.80% |
| Graduating Soon | 15.79% |
| Moving/Recently Moved | 14.37% |
Age range: 25-34 years
| Life event segment | % of borrower apps |
|---|---|
| Recently Married | 18.34% |
| Recently Graduated | 15.34% |
| Starting a Business Soon | 14.11% |
Age range: 35-44 years – No strong correlations in our data Age range: 45-54 years – No strong correlations in our data Age range: 55-64 years – No strong correlations in our data Age range: 65+ years – No strong correlations in our data
Purchases, refinances and renewals
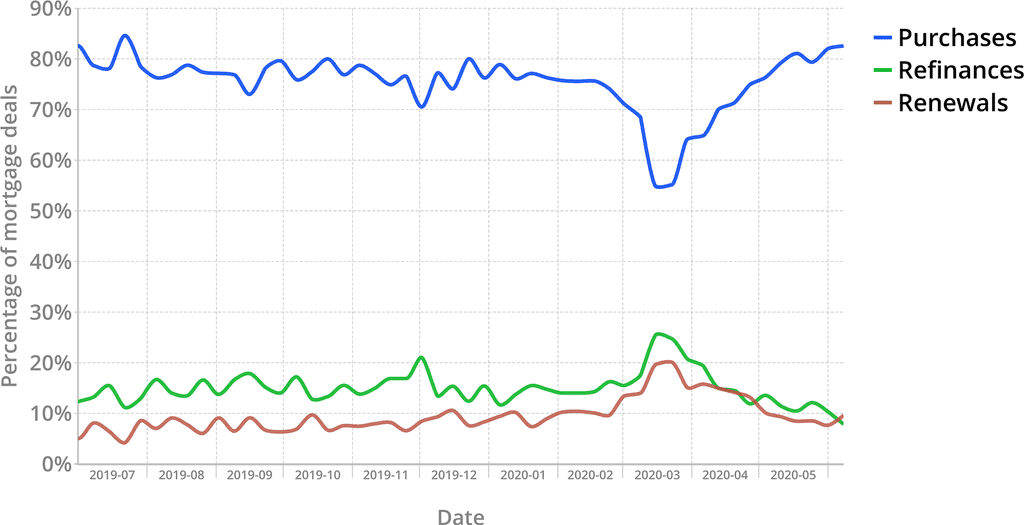
Through this chart we can see the effects of COVID-19 clearly. We see the uncertainty created by COVID-19 (on our platform) caused purchase mortgage applications to drop from 75% of total applications to 55%, and nearly a doubling in the percent of applications for renewals and refinances.
Lead generation/calculator funnels
| Borrowers clicked on | % of submitted applications |
|---|---|
| I’m just getting started | 50.03% |
| I have a specific home in mind | 29.80% |
| Want to refinance a home you own? | 19.90% |
For borrowers that entered the Finmo application through Finmo‘s lead generation funnel, this is the percentage of which “calculator” they clicked on.
Number of sessions
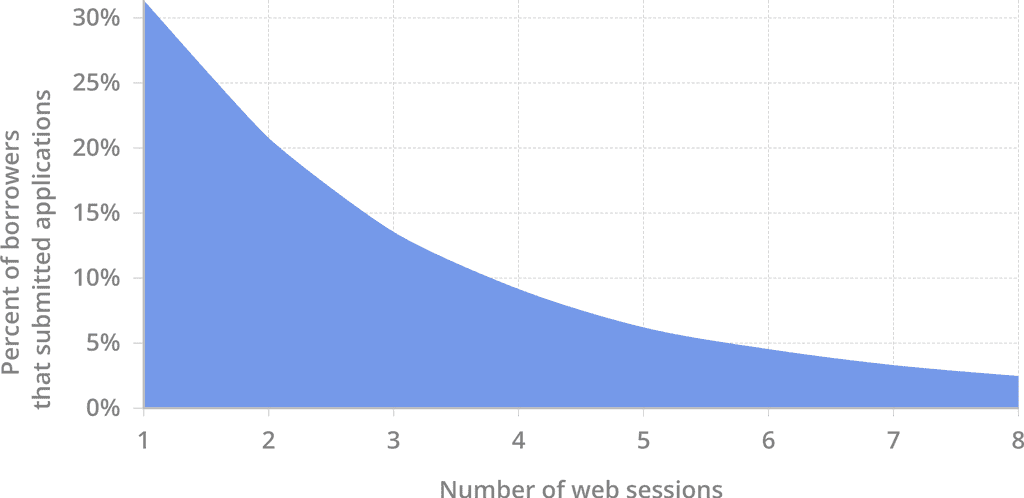
We can see in this figure that Finmo is an incredibly user friendly platform, with the majority of borrowers only needing to log in a single time to complete their application. This is even more impressive when you consider that applicants also upload their documentation in Finmo as well – the fact that they rarely have to log in again likely means they are experiencing very little friction, and completing their applications and document uploads easily.
Only around 6 percent of users have had to log in 5 times or more, and some of these borrowers may potentially be investor-types doing multiple deals for multiple properties.
Finmo mortgage professional statistics
Male/Female
Currently, there are more male mortgage professionals than female mortgage professionals using Finmo. We are unsure why this is.
Age
The age demographic of Finmo mortgage professionals demonstrates that younger mortgage professionals are quickly adopting DMPs, such as Finmo. Mortgage professionals that are 18-34 years old comprise 40.8% of all Finmo users. One of the biggest advantages for new mortgage professionals (who tend to be younger) gain by using Finmo is that they do not need to know how to originate a mortgage from memory. For example, they do not need to remember the specific information required for a purchase vs a refinance, or which documentation they need to request. In Finmo, the relevant fields are displayed in the application, and the appropriate documentation for virtually every type of deal is requested automatically.
Provinces

| Province | % of mortgage professionals |
|---|---|
| Ontario | 50.51% |
| British Columbia | 27.05% |
| Alberta | 12.72% |
| Nova Scotia | 3.68% |
| Quebec | 3.51% |
| Saskatchewan | 2.16% |
| New Brunswick | 1.27% |
| Manitoba | 0.63% |
| Prince Edward Island | 0.51% |
| Newfoundland and Labrador | 0.34% |
| Yukon | 0.13% |
| Northwest Territories | 0.00% |
| Nunavut | 0.00% |
This graph and table depict the percentage of mortgage professionals per province that are using Finmo. We expect the number of Quebec brokers to increase significantly since Finmo now features a bi-lingual mortgage application for borrowers.
Device categories
The majority of Finmo mortgage professionals originate mortgages on desktop computers. Surprisingly, approximately 11% do at least some of their mortgage origination work on their mobile phones. Finmo is fully mobile responsive, and all functionality is available cross platforms. With Finmo, theoretically you could run an entire mortgage business from a chair on the beach.
Mobile device brands
Finmo mortgage professionals have an affinity for Apple products. Finmo uses similar interface and design principles to Apple products, and perfectly compliments a modern mortgage professional seeking out the simplest, most intuitive mortgage origination solution.
Web browsers
| Browser | Device category | % of mortgage professionals |
|---|---|---|
| Chrome | Desktop | 56.48% |
| Safari | Desktop | 14.95% |
| Firefox | Desktop | 10.98% |
| Safari | Mobile | 7.46% |
| Edge | Desktop | 6.28% |
| Chrome | Mobile | 2.71% |
| Samsung Internet | Mobile | 0.53% |
| Others | Various (including tablets) | 0.60% |
Mortgage professionals prefer the Google Chrome browser on their desktop computers, and the Apple Safari browser on their mobile phones.
resources
Lendesk Youtube channel
The Lendesk YouTube Channel contains all of our video resources. It has more than 50 videos, including training videos, webinar sessions, tips and tricks, and more! It’s a great way for visual learners to get acquainted with Finmo quickly. We recommend starting with these Finmo introduction videos.
help centre
The Finmo help centre is a searchable index of over 130 articles on Finmo. The articles are grouped into easily navigable categories, and are an indispensable resource for self-learners. We understand that not being able to find an answer to a problem can impact productivity, so we strive to provide the best documentation of any Digital Mortgage Platform.
Customer success team
Our customer success team is available during regular work hours (and often after hours) through the following channels:
- Finmo’s in-app chat
- E-mail: support@finmo.ca
- Phone number: 1-855-575-0413
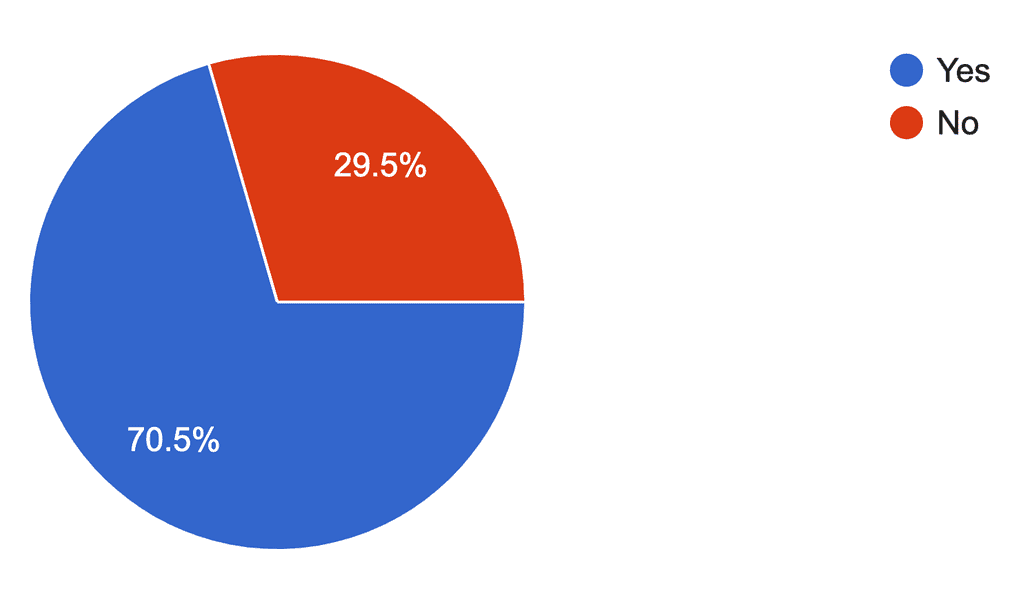
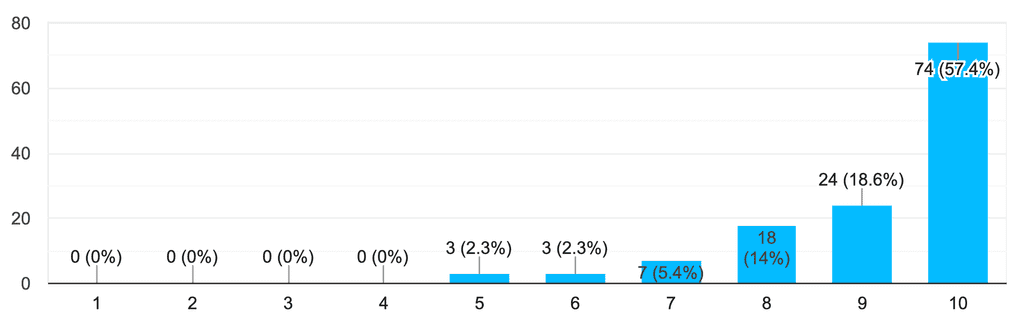
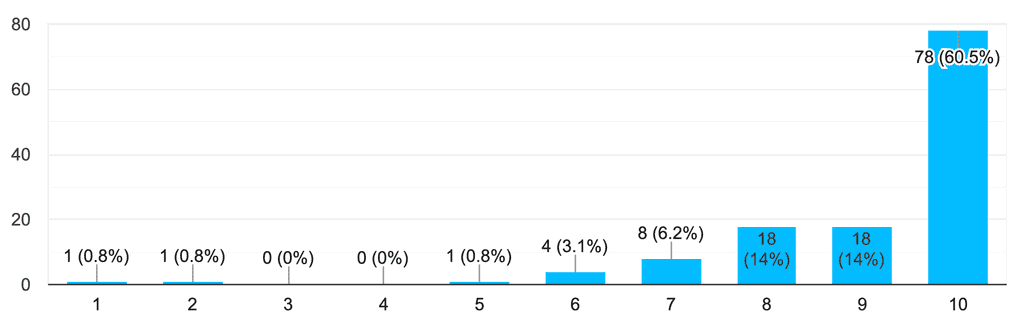
Finmo internal survey
On January 28th 2020, we performed an online survey of 129 of our users.
Do you believe Finmo is helping you close more deals?
How would you rate the customer support available to you?
How likely would you be to recommend Finmo to a colleague?
Finmo user reviews
Try Finmo
Thank you for reading our whitepaper on mortgage market insights. If you believe Finmo would be a good fit for you, feel free to sign up or schedule a demo with us.